Traffic and Pollution
Anyone who lives in Wilburton will know that we have a traffic issue - particular in the morning and evening peak hours. During the SWCLT presentation, a Traffic Analysis slide was shown. We have now had confirmation that the figures given by the SWCLT transport consultant represent each-way figures - so 5,000 daily (each-way, 24 hour) being 10,000 total and 500 each-way peak being 1,000 in total along the A1123. This aligns with the last manual traffic count (count point 27562 - for Cambridgeshire) in 2016 which was 9095.
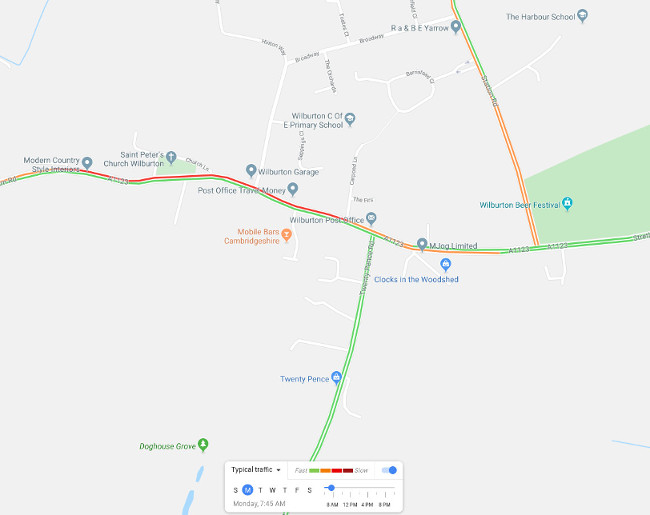 The Architects have asked us to remove their images so this is a "typical traffic" map from Google Maps - showing the typical traffic in Wilburton just before 8am on a Monday morning. An evening map shows queues along Twenty Pence Road.
Please visit the SWCLT website to see the board containing the traffic diagram.
The Architects have asked us to remove their images so this is a "typical traffic" map from Google Maps - showing the typical traffic in Wilburton just before 8am on a Monday morning. An evening map shows queues along Twenty Pence Road.
Please visit the SWCLT website to see the board containing the traffic diagram.
Also discussed at the pre-submission presentation were the figures for the peak traffic from the development, as County Highways had suggested that a figure of 50 was too low. At the presentation, the consultant had increased this to 85, or 150 over the 2 hour peak period. He claimed this would be only an 8.8% in peak traffic on the A1123 - and suggested that would make little difference to traffic flow. As the road is already running near to capacity, as can be seen from the Google Maps typical traffic flow, any increase is significant. This also represents a high percentage of out-commuting from the development - indicating that it is not a sustainable location (having a high level of car dependency). Given that they claim only 25% of traffic (250 cars) is generated from Wilburton - this represents a considerably increase in village-generated traffic.
The initial daily two-way figure of 480 for 120 houses is low (it may have been increased now - we were not allowed to see a transport assessment). Using the TRICS figures for Manor Farm, Stretham (based on low car ownership developments in urban and edge of town areas - so an underestimate for rural areas), a daily total figure 705 is produced - considerably higher than that shown during the SWCLT presentation. Using the same TRICS data, morning and evening peak is around 76 and 80 - which they have now aligned with. Using TRICS data for development in Soham (168 houses, 77% car use for trips generated), the figures are 110 for am peak, 97 for pm peak and 878 total - higher than presented for the SWCLT site.
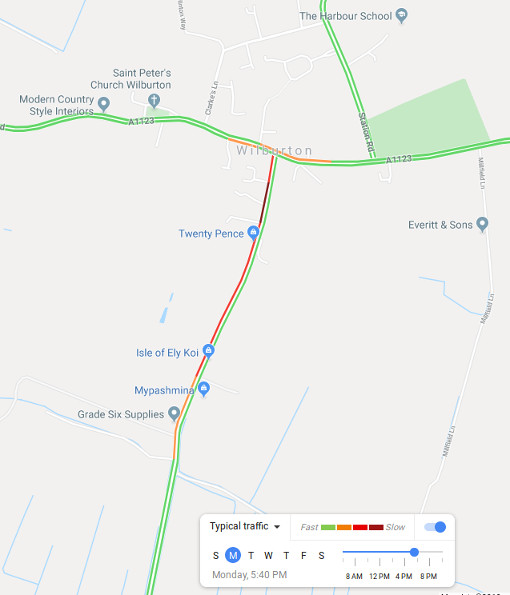 Typical evening traffic, via Google Maps, showing the extensive queuing down Twenty Pence Road - this being 5:40pm on a Monday - longer queues can be obtained as "typical" measurements.
For traffic calming, we are presented with a new crossing and the possibility of moving the 30mph limit. Both of these are decided by County Highways - so cannot be guaranteed. It is also questionable whether a crossing, used by children, should count as "traffic calming"! As to the knock on effect of both traffic leaving the development and people using the crossing will have on traffic in through the village, no indication or analysis was given - so we will need to analyse the transport assessment to see the details.
Wilburton is currently undergoing pollution monitoring by ECDC - as levels were found to be exceptionally high for a rural location. Any additional traffic will add to this - regardless of whether the traffic is "through" traffic or from the village. Studies have shown that the amount of pollution produced in the first 5 minutes is double that of a warm engine - so traffic generated by the development could count as double in terms of pollution (until everyone drives electric cars). A significant amount of work needs to be carried out in terms of traffic analysis and pollution analysis before any further discussion of a potential development is undertaken - for the health and safety of the residents of Wilburton.
Next - The SWCLT Leaflet